Customer segmentation is the marketing strategy that divides customers into different groups based on some specific ways of similarity. Marketing teams can tailor their content and media to unique audiences according to the segmentations. BigQuery, the analytics data warehouse on Google Cloud, now enables users to create and execute machine learning models with standard SQL to address such solution easily and quickly.
Introduction
BigQuery ML is a capability inside BigQuery that allows data scientists and analysts to build and operationalize machine learning models in minutes on massive structured or semi-structured datasets. BigQuery ML democratizes predictive analytics so that data analysts unfamiliar with programming languages like Python and Java can build machine learning models with basic SQL queries.
Solution
Just following the steps below, we can create the K-means model to build customer segmentations. All is done within the BigQuery console.
Step 1: Create the model
With SQL-like queries, we can create and train the k-means clustering model. We just need to provide is the k (number of clusters), distance metric, and features.
1
2
3
4
5
6
7
8
9
10
11
12
13
CREATE MODEL
  my_dataset.customer_segmentation_1
OPTIONS
  ( model_type = 'kmeans',
    num_clusters = 3,
    distance_type = 'euclidean') AS
SELECT
  Age,
  Income,
  CCAvg,
  Mortgage
FROM
  my_dataset.abcbank
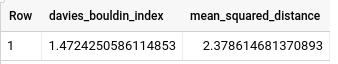
Step 2: Evaluate the model
The evaluation provides metrics as Davies–Bouldin index and Mean squared distance.
1
2
3
4
SELECT
  *
FROM
  ML.EVALUATE(model my_dataset.customer_segmentation_1)
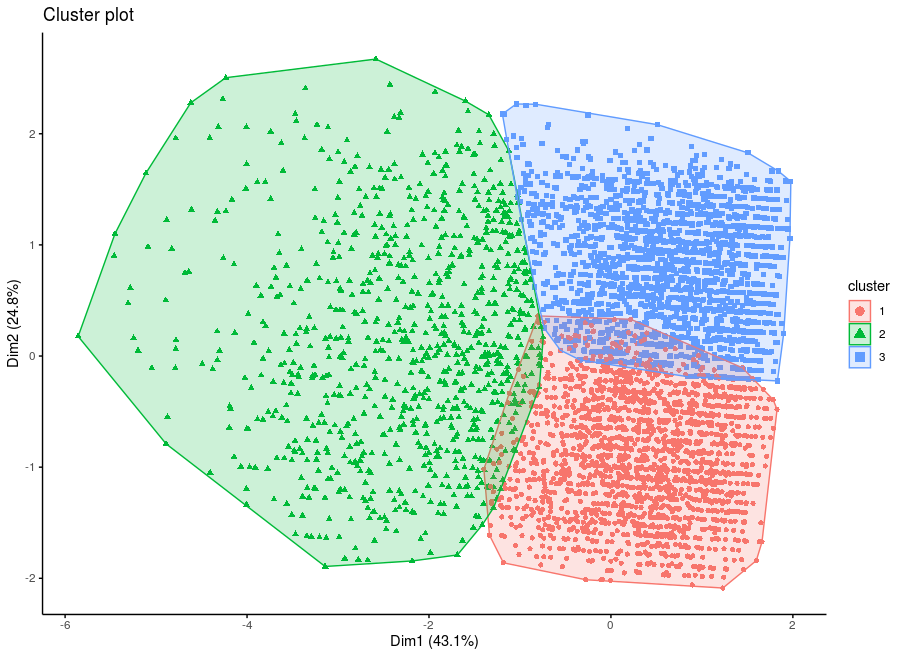
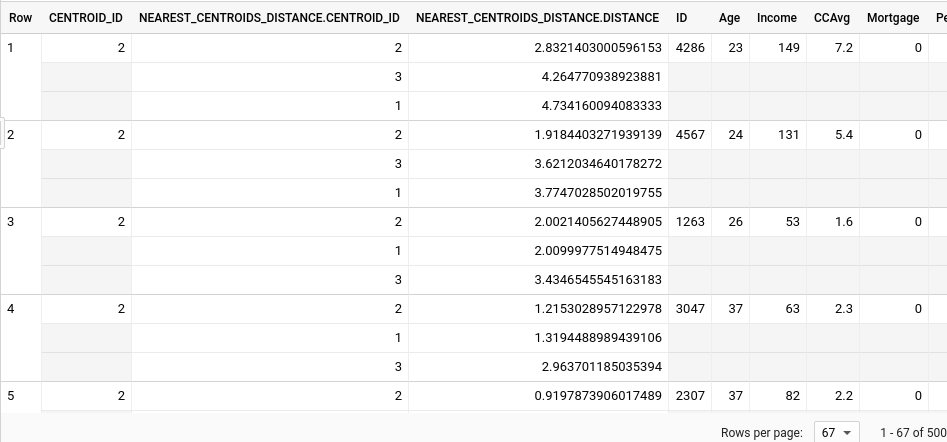
Step 3: Make prediction with the trained model
We can then get the clustering result for each observation.
1
2
3
4
5
6
7
8
9
10
11
SELECT
  *
FROM
  ML.PREDICT(model my_dataset.customer_segmentation_1,
    table my_dataset.abcbank)

SELECT
  centroid_id, ID, Age, Income, CCAvg, Mortgage
FROM
  ML.PREDICT(model my_dataset.customer_segmentation_1,
    table my_dataset.abcbank)
The output looks like below. We can see that each observation is assigned to the cluster with the shortest distance to the centroid.
K-means under the hood
K-means is an unsupervised machine learning technique which works on datasets without labels. K-means is one of the most popular “clustering” algorithms. It will group data into clusters which are similar to one another.
The goals for K-means to achieve are:
- The distance between observations within a cluster should be as small as possible.
- The distance of the centroids should be as big as possible.
Here are the steps to implement k-means clustering algorithm.
-
Specify the value of k (number of clusters), and the distance metric (i.e. Euclidean distance).
-
Initialise k centroids.
-
For each observation, calculate the distance to each centroid. Then assign the observation to the cluster which the distance from the observation to the centroid is the shortest.
-
For each cluster, re-calculate the new centroid which is the center (mean) of all the observations in each cluster.
-
Repeat step 3 and 4, until the result is converged or reached to the pre-defined iteration.
The above approach is called Expectation-Maximization. Step 3 is the E-step, and step 4 is the M-step. There are some variants for step 2 to initialise the centroids (i.e. k-means++) which will lead to speed up the whole process.
K-means implemented with Python
Below is the K-means implementation written in Python with Numpy.
1
2
3
4
5
6
7
8
9
10
11
12
13
14
15
16
17
18
19
20
21
22
23
24
25
26
27
28
29
30
31
32
33
34
35
36
37
38
39
40
41
42
43
44
45
46
47
48
49
50
51
52
53
54
55
56
57
58
59
60
61
import numpy as np

def euclidean_distance(M, v):
    """
    Compute the Euclidean distance

    Args:
    =====
    M: matrix of observations
    v: data point as a vector

    Return:
    =======
    The distances to v for each observation
    """
    assert M.shape[1] == v.shape[0]
    distance = np.sqrt(np.sum((M - v) ** 2, axis=1))
    return distance


def kmeans(M, k, iterations=20):
    """
    Implement k-means clustering with Euclidean distance

    Args:
    =====
    M:          matrix of observations
    k:          number of clusters
    iterations: max number of iterations k-means algorithm to run

    Return:
    =======
    centoids:   the centroids of the clusters
    clusters:   cluster id for each observation
    distances:  distances to centroids for each observation
    """
    # initialise the centroids
    pos = np.random.choice(np.arange(M.shape[0]), size=k, replace=False)
    centroids = M[pos, :]

    # initialise the distances matrix
    distances = np.zeros((M.shape[0], centroids.shape[0]))
    prev_distances = distances.copy()

    for _ in range(iterations):
        # calculate the distance for each observation
        for i in range(centroids.shape[0]):
            distances[:, i] = euclidean_distance(M, centroids[i, :])
        if np.array_equal(distances, prev_distances):
            break
        del prev_distances
        prev_distances = distances.copy()

        # assign observation to the cluster
        clusters = np.argmin(distances, axis=1)

        # update the centroids
        for i in range(centroids.shape[0]):
            centroids[i, :] = np.mean(M[clusters==i, :], axis=0)

    return centroids, clusters, distances
Choose the best K
When using k-means clustering, the most important parameter is a target number of clusters to generate, k. In practice, we rarely know the “true” number of clusters in advance, so the best practice is to try several values of k until the average intracluster distance stops decreasing dramatically.
We can test with a given ranging and use the elbow method to chose the correct k. The idea of the elbow method is to run k-means clustering on the dataset for a range of values of k, calculate Within Set Sum of Squared Error (WSSSE) and select the best k based on the sudden drop in WSSSE.
Soure code can be found here.
Ref:
- Credit to Emilee McWilliams for the data source and R code
- Predictive marketing analytics using BigQuery ML machine learning templates
- K-means Cluster Analysis
- Understanding and Using k-means Clustering