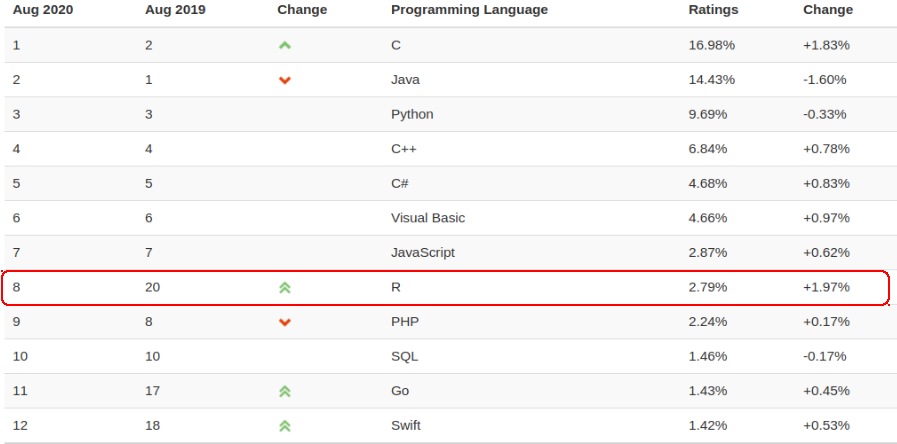
R has risen to number 8 from number 20 last year in the latest TIOBE index (August 2020), and is on the way to become TIOBE’s programming language of the year 2020. It is definitely worth writing down my journey with R.
Get to know R
I got to know R as a programming language when I was doing my master degree in the University of Sydney. R is mainly used for statistical computing. It has a bit weird assignment operator as x <- value. The result of a statistical function is sometimes with a lengthy output. It was said Pandas was created with the inspiration of dataframe in R. I only used R to finish some assignments as required. And that is it.
The jaw-dropping impression of R
It was not until I joined the Network Analytics and Insight team, I had a second chance to use R. Vikram, the boss, showed me an interactive dashboard. It contained network performace analysis, a high-level summary view, detailed KPIs of voice and data services, geo-maps showing device distribution, and other more information. It was a standalone HTML file which can be easily distributed to the target customers. More importantly, Vikram used R to generate all of them.
I was amazed that R can not only be used to perform complicated analysis with large amount of data, it is also very competent to produce attractive visualisation. I then added some more features such as applying Prophet package to forecast the usage and number of devices, setting up to refresh the dashboard in a weekly basis.
The shiny aspects of R
We had the R server and Shiny server installed on the edge layer of the big-data platform. It provided the flexibility to access petabytes of data stored in HDFS while end users could access different dashboards created by the Shiny apps.
The second project we embarked on was a near real-time network KPIs interactive dashboard powered by Shiny app. Users can view the network performance on various levels (national, state, site, cell, etc.). With multiple filters, it can easily to drill down to the problematic sites causing network degradation. It provided a geo-map showing all the network sites. With a simple click, it would pop up the graphs of KPIs of the selected site.
Behind the scene, we built up the whole pipeline of from data ingestion, processing to visualisation. Once the network performance data were generated in OSS, they were ingested and processed with Spark and Hive jobs in the cluster. Then R scripts were kicked off to fetch, aggregate and enrich the newly available data. The Shiny app was automatically refreshed with the latest data.
We were then tasked to develop a prototype solution to detect anomalies in the network. We evaluated some open-source algorithms, processed all the input data into suitable format, presented the results with the interactive dashboard, and sent the alert emails to end users if anomalies were detected.
The Regretting
There are quite a few other projects we delivered using R and got positive feedbacks. However, Vikram left the team all of sudden. I also left a couple months later. I mainly worked on projects based on cloud while I had much less chances to use R after that.
All in all, the opportunity of learning from Vikram and the time working along with him and all the R projects are definitely the shiny moments of my career life.