My notes for for the course of AWS Data Analytics Fundamentals.
Data source
There are three broad classifications of data source types:
- Structured data is organized and stored in the form of values that are grouped into rows and columns of a table.Structured data is hot, immediately ready to be analyzed.
- Semistructured data is often stored in a series of key-value pairs that are grouped into elements within a file. Semistructured data is lukewarm—some data will be ready to go and other data may need to be cleansed or preprocessed.
- Unstructured data is not structured in a consistent way. Some data may have structure similar to semi-structured data but others may only contain metadata. Unstructured data is the frozen ocean—full of exactly what you need but separated by all kinds of stuff you don’t need.
Benefits of data lake
- Single source of truth. Be careful not to let your data lake become a swamp. Enforce proper organization and structure for all data entering the lake.
- Store any type of data. Be careful to ensure that data within the data lake is relevant and does not go unused. Train users on how to access the data, and set retention policies to ensure the data stays refreshed.
- Enable analysis with AI and ML. Be careful to learn how to use data in new ways. Don’t limit analytics to typical data warehouse-style analytics. AI and machine learning offer significant insights.
AWS Lake Formation is a service that organizes and curates data within Amazon S3 data lakes. This service ensures the security and compliance of items within the lake as well as orchestrates transformation jobs utilizing the data lake and other AWS services.
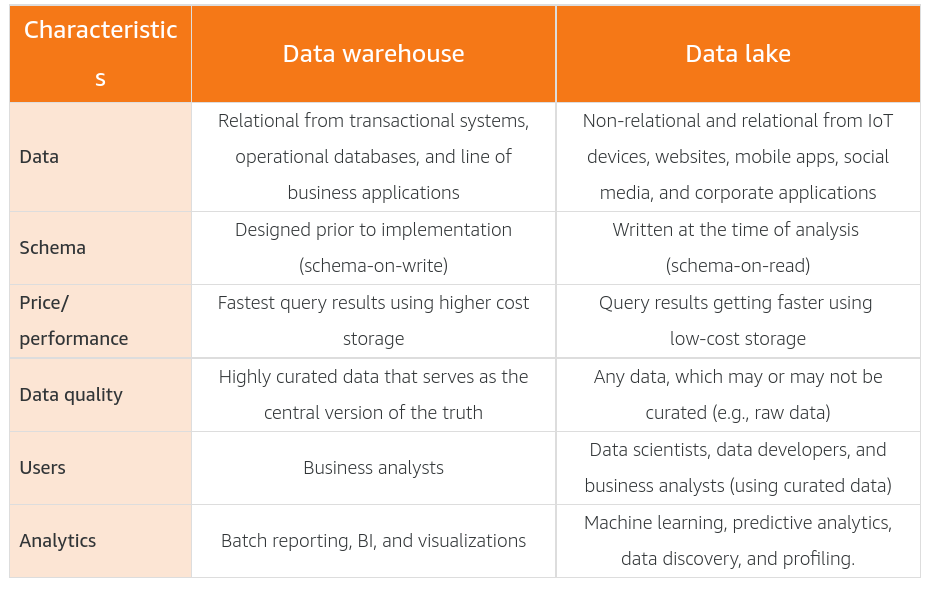
Data Warehouse vs Data Lake
A data lake is a centralized repository that allows you to store structured, semistructured, and unstructured data at any scale.
A data warehouse is a central repository of structured data from many data sources. This data is transformed, aggregated, and prepared for business reporting and analysis.
A subset of data from a data warehouse is called a data mart. Data marts only focus on one subject or functional area. A warehouse might contain all relevant sources for an enterprise, but a data mart might store only a single department’s sources. Because data marts are generally a copy of data already contained in a data warehouse, they are often fast and simple to implement.
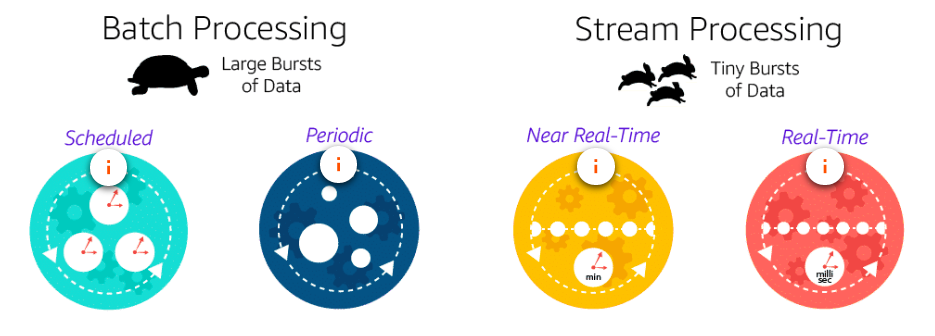
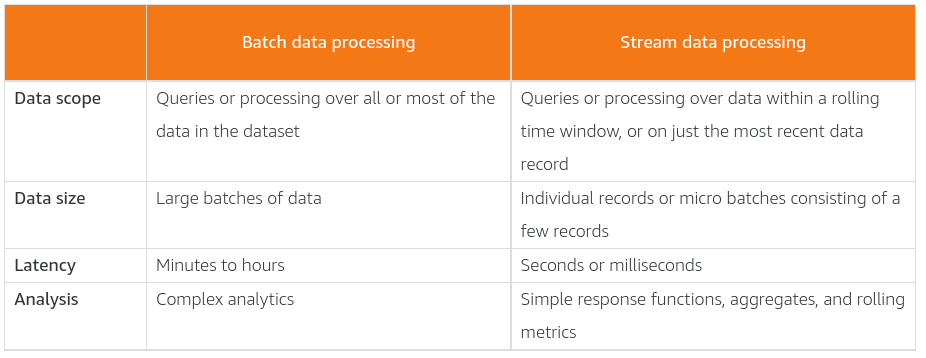
Data processing - batch and streaming
Data processing is to transform and make them consumable. It includes cleaning, normalising, enriching. As part of the processing, the data will be also analyzed, which usually means sorting, aggregating, joining, and applying business logic to produce meaningful insights. Data processing defines the methods that are used to collect data and present it to storage or analytic mechanisms.
The architecture diagram below depicts the components and the data flow of a basic batch analytics system using a traditional approach. This approach uses Amazon S3 for storing data, AWS Lambda for intermediate file-level ETL, Amazon EMR for aggregated ETL (heavy lifting, consolidated transformation, and loading engine), and Amazon Redshift as the data warehouse hosting data needed for reporting.

In the following architecture, streaming data is collected by the same Amazon Kinesis Data Firehose service seen in the above architecture. This time however, the data is placed directly into an Amazon S3 bucket. A separate process loads user device settings into a second Amazon S3 bucket. AWS Glue is then used to combine the two Amazon S3 data stores and transform them into a single result set, which is loaded into a third Amazon S3 bucket at the Serving Layer.
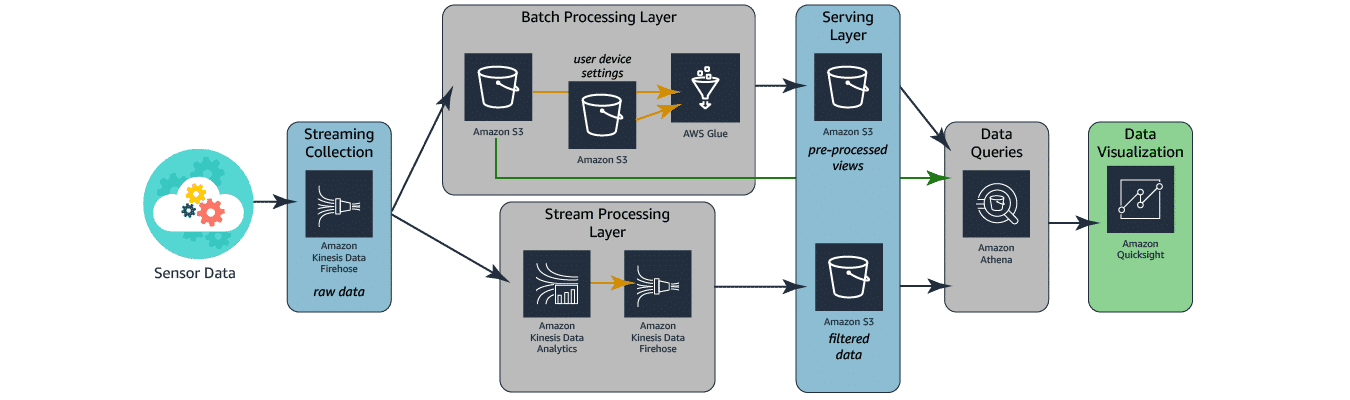
Using Amazon Athena, the data in the third Amazon S3 bucket can now be queried. Amazon QuickSight can be used to produce dashboards that include content from both Amazon Athena and the first Amazon S3 bucket where the raw streaming data was loaded. This allows the business to perform comparative analysis on the data.
In an OLTP system, the most common queries are called lookup queries. These queries need to return several columns of data for each matching record. The filters on this data are generally based on the key columns in that table. In this type of system, you might query to get details for a specific order.
In an OLAP system, the most common queries are aggregate queries. These queries take large numbers of rows and reduce them to a single row by aggregating the values in one or more columns. In this type of system, you might query to find out the total number of items sold on a specific date.
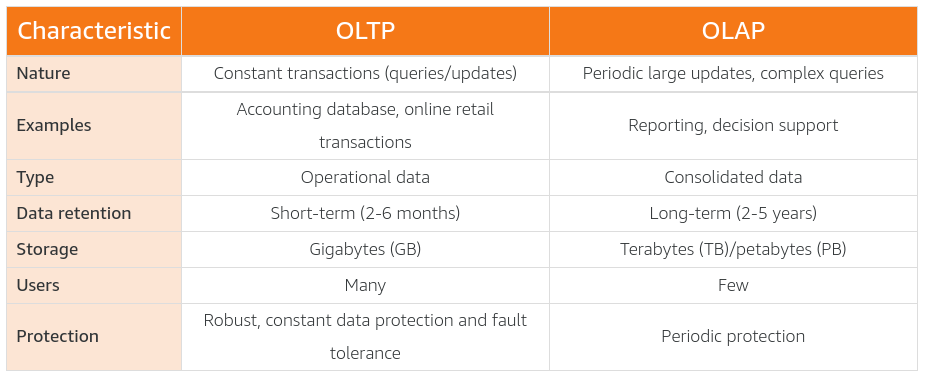
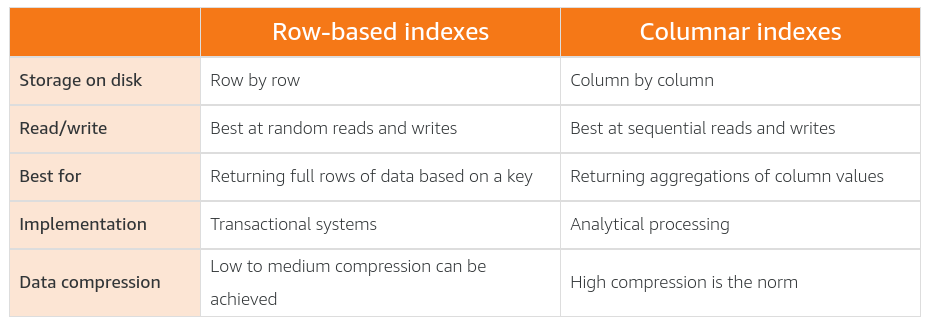
To cater for the different query requirements, there are different indexing approaches for OLTP and OLAP systems.
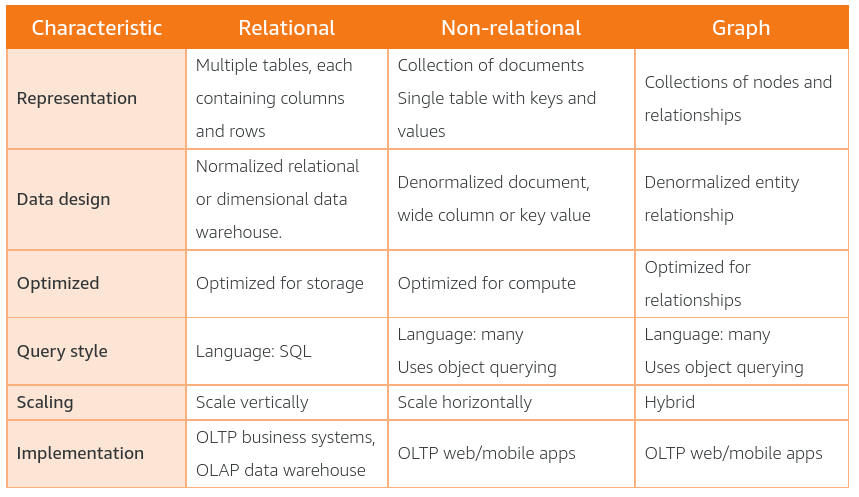
Non-relational databases are built to store semistructured and unstructured data in a way that provides for rapid collection and retrieval.
Data Veracity
- Curation is the action or process of selecting, organizing, and looking after the items in a collection.
- Data integrity is the maintenance and assurance of the accuracy and consistency of data over its entire lifecycle.
- Data veracity is the degree to which data is accurate, precise, and trusted.
- Data cleansing is the process of detecting and correcting corruptions within data.
- Referential integrity is the process of ensuring that the constraints of table relationships are enforced.
- Domain integrity is the process of ensuring that the data being entered into a field matches the data type defined for that field.
- Entity integrity is the process of ensuring that the values stored within a field match the constraints defined for that field.
Here are a few best practices to help you identify data integrity issues. - Know what clean looks like - Know where the errors are coming from - Know what acceptable changes look like - Know if the original data has value
An information schema is a database of metadata that houses information on the data objects within a database. Microsoft SQL Server calls its information schema the master database. Oracle uses data dictionary tables and a metadata registry. Apache Hadoop uses a metastore.
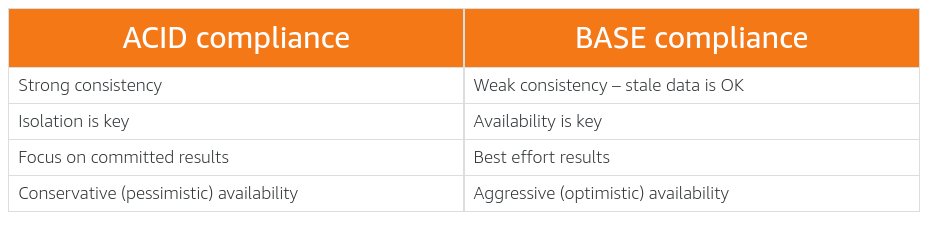
ACID is an acronym for Atomicity, Consistency, Isolation, and Durability. It is a method for maintaining consistency and integrity in a structured database.
BASE is an acronym for Basically Available Soft state Eventually consistent. It is a method for maintaining consistency and integrity in a structured or semistructured database.
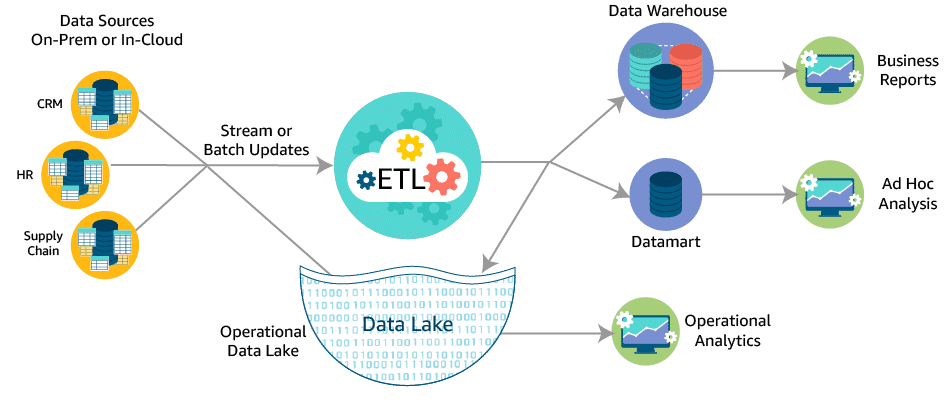
ETL process
ETL—Extract, Transform, Load—is the process of collecting data from raw data sources and transforming that data into a common type. This new data is loaded into a final location to be available for analytical analysis and inspection. In modern cloud-based environments, we often refer to this process as ELT (Extract, Load, Transform) instead.
Transforming your data into a uniform, queryable format is really the heart of the ETL process.
 ETL process can
- To ensure the data has the required accuracy, precision, and depth
- To bring together data from different sources to gain a complete picture
- To build purpose-built data sets to answer key business questions
Amazon EMR is a more hands-on approach to creating your data pipeline. This service provides a robust data collection and processing platform. Using this service requires you to have strong technical knowledge and know-how on your team. The upside of this is that you can create a more customized pipeline to fit your business needs. Additionally, your infrastructure costs may be lower than running the same workload on AWS Glue.
AWS Glue is a serverless, managed ETL tool that provides a much more streamlined experience than Amazon EMR. This makes the service great for simple ETL tasks, but you will not have as much flexibility as with Amazon EMR. You can also use AWS Glue as a metastore for your final transformed data by using the AWS Glue Data Catalog. This catalog is a drop-in replacement for a Hive metastore.
Data Value
Information analytics is the process of analyzing information to find the value contained within it. This term is often synonymous with data analytics.
Operational analytics is a form of analytics that is used specifically to retrieve, analyze, and report on data for IT operations. This data includes system logs, security logs, complex IT infrastructure events and processes, user transactions, and even security threats.
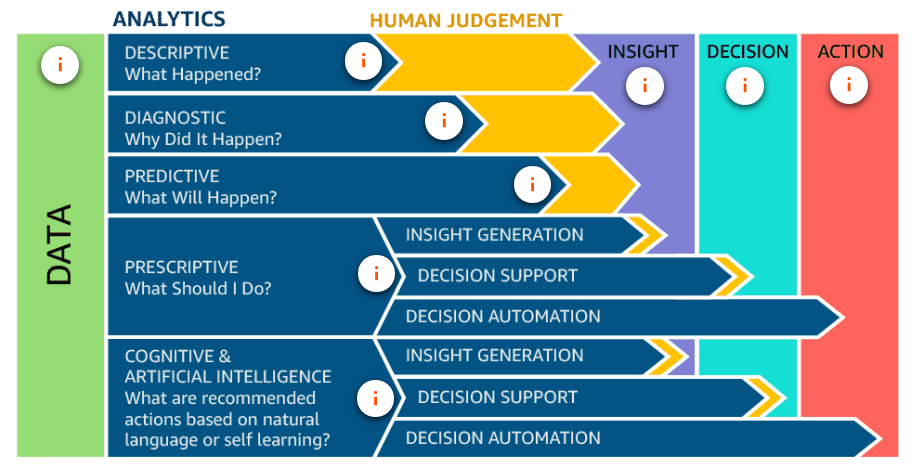
- Questions relating to past events are answered using descriptive analytics.
- Questions comparing current data sets to past data sets are answered using diagnostic analytics.
- Questions looking for predictions of future events are answered using predictive analytics.
- Questions looking for recommendations based on preferences or prior purchase history are answered using prescriptive analytics.
- Questions that require analysis of video, images, and voice are answered using cognitive analytics.
There are three broad types of reports: static, interactive, and dashboards.
- Static reports have not died out in this digital age. In fact, they are still hugely popular for presentations and meetings. The are found in the form of PDFs and PowerPoint slides and can often be accessed through web portals and software interfaces.
- Interactive reports are becoming more common all the time. These types of reports generally fall under the heading of self-service business intelligence. These reports often take on a print-based report style but have the advantage that consumers can apply filters to charts and graphs, change the scales, and even group and sort values within the reports. This allows a consumer to tell their own story using the foundation laid by the report builder.
- Dashboards are another very popular reporting tool. Whether dashboards are interactive depends on the software used. Consumers find the greatest benefit in dashboards when they focus on high-level roll-ups of key business factors.
Reference
Image by Free-Photos from Pixabay